Visualização de dados
By R. O. Perdiz in Python AED Plot Operações
June 19, 2024
Carregando módulos Python e lendo os dados
import pandas as pd
pd.__version__
## '2.2.2'
import numpy as np

dad = pd.read_csv("https://archive.ics.uci.edu/ml/machine-learning-databases/autos/imports-85.data", header = None)
headers = ["symboling", "normalized-losses", "make", "fuel-type", "aspiration", "num-of-doors", "body-style", "drive-wheels", "engine-location", "wheel-base", "length", "width", "height", "curb-weight", "engine-type", "num-of-cylinders", "engine-size", "fuel-system", "bore", "stroke", "compression-ratio", "horsepower", "peak-rpm", "city-mpg", "highway-mpg", "price"]
dad.columns = headers
dad.head(5)
##    symboling normalized-losses         make  ... city-mpg highway-mpg  price
## 0          3                 ?  alfa-romero  ...       21          27  13495
## 1          3                 ?  alfa-romero  ...       21          27  16500
## 2          1                 ?  alfa-romero  ...       19          26  16500
## 3          2               164         audi  ...       24          30  13950
## 4          2               164         audi  ...       18          22  17450
##
## [5 rows x 26 columns]
Conversão de variáveis para tipo numérico
Algumas vezes, os dados não são automaticamente convertidos para o tipo de informação correta.
Por exemplo, preço do carro (“price”) foi lido como um “object”, isto é, pode conter palavras, letras, caracteres. Porém, trata-se de um número de fato.
Então, vamos convertê-lo usando o método to_numeric().
dad["price"] = pd.to_numeric(dad["price"], errors = "coerce")
Há outras variáveis assim também. Vejam:
dad[["horsepower"]].dtypes
## horsepower    object
## dtype: object
dad[["normalized-losses"]].dtypes
## normalized-losses    object
## dtype: object
dad["horsepower"] = pd.to_numeric(dad["horsepower"], errors = "coerce")
dad["normalized-losses"] = pd.to_numeric(dad["normalized-losses"], errors = "coerce")
Operações
Média
Para calcular a média de uma coluna, usamos o método mean().
Vamos testar com as colunas “price” e “normalized-losses”.
dad[["price"]].mean()
## price    13207.129353
## dtype: float64
dad["normalized-losses"].mean()
## 122.0
Valores únicos
dad["make"].unique()
## array(['alfa-romero', 'audi', 'bmw', 'chevrolet', 'dodge', 'honda',
##        'isuzu', 'jaguar', 'mazda', 'mercedes-benz', 'mercury',
##        'mitsubishi', 'nissan', 'peugot', 'plymouth', 'porsche', 'renault',
##        'saab', 'subaru', 'toyota', 'volkswagen', 'volvo'], dtype=object)
Correlações
dad.corr(numeric_only = True)
##                    symboling  normalized-losses  ...  highway-mpg     price
## symboling           1.000000           0.528667  ...     0.034606 -0.082391
## normalized-losses   0.528667           1.000000  ...    -0.210768  0.203254
## wheel-base         -0.531954          -0.074362  ...    -0.544082  0.584642
## length             -0.357612           0.023220  ...    -0.704662  0.690628
## width              -0.232919           0.105073  ...    -0.677218  0.751265
## height             -0.541038          -0.432335  ...    -0.107358  0.135486
## curb-weight        -0.227691           0.119893  ...    -0.797465  0.834415
## engine-size        -0.105790           0.167365  ...    -0.677470  0.872335
## compression-ratio  -0.178515          -0.132654  ...     0.265201  0.071107
## horsepower          0.071622           0.295772  ...    -0.770908  0.810533
## city-mpg           -0.035823          -0.258502  ...     0.971337 -0.686571
## highway-mpg         0.034606          -0.210768  ...     1.000000 -0.704692
## price              -0.082391           0.203254  ...    -0.704692  1.000000
##
## [13 rows x 13 columns]
Coeficiente de correlação de Pearson
from scipy.stats import pearsonr
pearsonr(dad["horsepower"], dad["price"])
## ValueError: array must not contain infs or NaNs
Há valores ausentes nas colunas. Vamos removê-las:
dad.dropna(subset = ["price"], axis = 0, inplace = True)
dad.dropna(subset = ["horsepower"], axis = 0, inplace = True)
pearson_coef, p_value = pearsonr(dad["horsepower"], dad["price"])
Coeficiente de correlação de Pearson é:
pearson_coef
## 0.8105330821322065
Já o valor de p é:
p_value
## 1.1891278276944886e-47
Agrupamentos
Utilizamos o método groupby().
Vamos ver como os preços de carros se apresentam entre essas duas variáveis, “drive-wheels” e “body-style”.
dados_parciais = dad[["drive-wheels", "body-style", "price"]]
dados_parciais
##     drive-wheels   body-style    price
## 0            rwd  convertible  13495.0
## 1            rwd  convertible  16500.0
## 2            rwd    hatchback  16500.0
## 3            fwd        sedan  13950.0
## 4            4wd        sedan  17450.0
## ..           ...          ...      ...
## 200          rwd        sedan  16845.0
## 201          rwd        sedan  19045.0
## 202          rwd        sedan  21485.0
## 203          rwd        sedan  22470.0
## 204          rwd        sedan  22625.0
##
## [199 rows x 3 columns]
dados_grupos = dados_parciais.groupby(["drive-wheels", "body-style"], as_index = False).mean()
dados_grupos
##    drive-wheels   body-style         price
## 0           4wd    hatchback   7603.000000
## 1           4wd        sedan  12647.333333
## 2           4wd        wagon   9095.750000
## 3           fwd  convertible  11595.000000
## 4           fwd      hardtop   8249.000000
## 5           fwd    hatchback   8365.166667
## 6           fwd        sedan   9811.800000
## 7           fwd        wagon  10061.181818
## 8           rwd  convertible  23949.600000
## 9           rwd      hardtop  24202.714286
## 10          rwd    hatchback  14337.777778
## 11          rwd        sedan  21711.833333
## 12          rwd        wagon  16994.222222
Tabelas dinâmicas (==“Pivot table”)
Criamos tabelas dinâmicas por meio do método pivot().
Em uma tabela dinâmica, temos uma variável ao longo das linhas, enquanto outra variável aparece nas colunas.
dados_dinamicos = dados_grupos.pivot(index = "drive-wheels", columns = "body-style")
dados_dinamicos
##                    price                ...
## body-style   convertible       hardtop  ...         sedan         wagon
## drive-wheels                            ...
## 4wd                  NaN           NaN  ...  12647.333333   9095.750000
## fwd              11595.0   8249.000000  ...   9811.800000  10061.181818
## rwd              23949.6  24202.714286  ...  21711.833333  16994.222222
##
## [3 rows x 5 columns]
Podemos preencher valores faltantes com 0, para facilitar a visualização dos dados:
dados_dinamicos.fillna(0)
##                    price                ...
## body-style   convertible       hardtop  ...         sedan         wagon
## drive-wheels                            ...
## 4wd                  0.0      0.000000  ...  12647.333333   9095.750000
## fwd              11595.0   8249.000000  ...   9811.800000  10061.181818
## rwd              23949.6  24202.714286  ...  21711.833333  16994.222222
##
## [3 rows x 5 columns]
Importando módulos para visualização de dados
from matplotlib import pyplot as plt

import seaborn as sns
Visualização
Linhas
x = [1, 2, 3, 4]
y = [1, 4, 9, 6]

plt.plot(x, y)
plt.show()

Dispersão
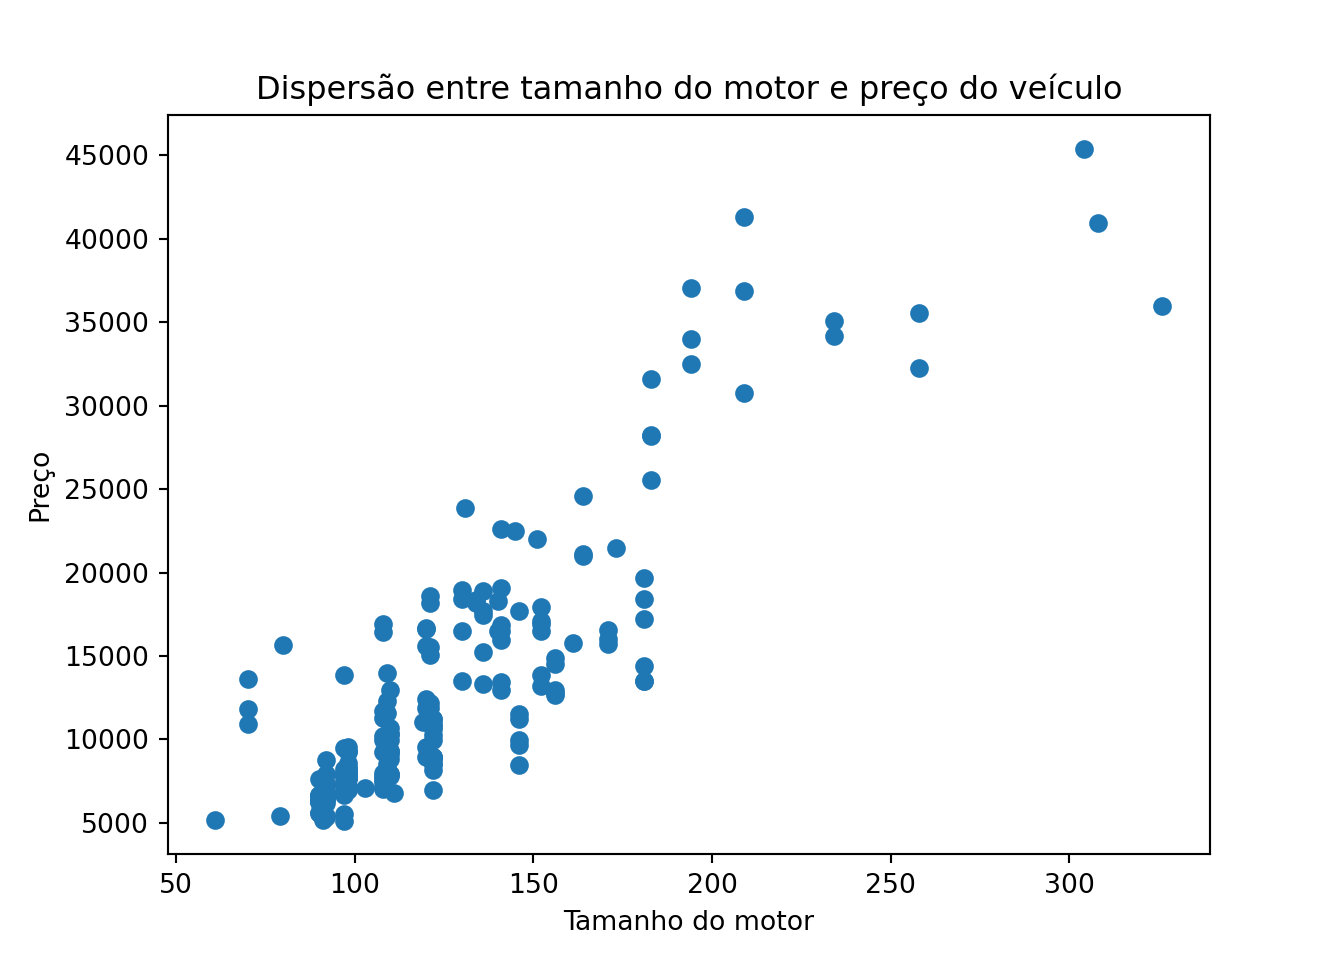
plt.scatter(dad["engine-size"], dad["price"])
plt.title("Dispersão entre tamanho do motor e preço do veículo")
plt.xlabel("Tamanho do motor")
plt.ylabel("Preço")
plt.show()
Histograma
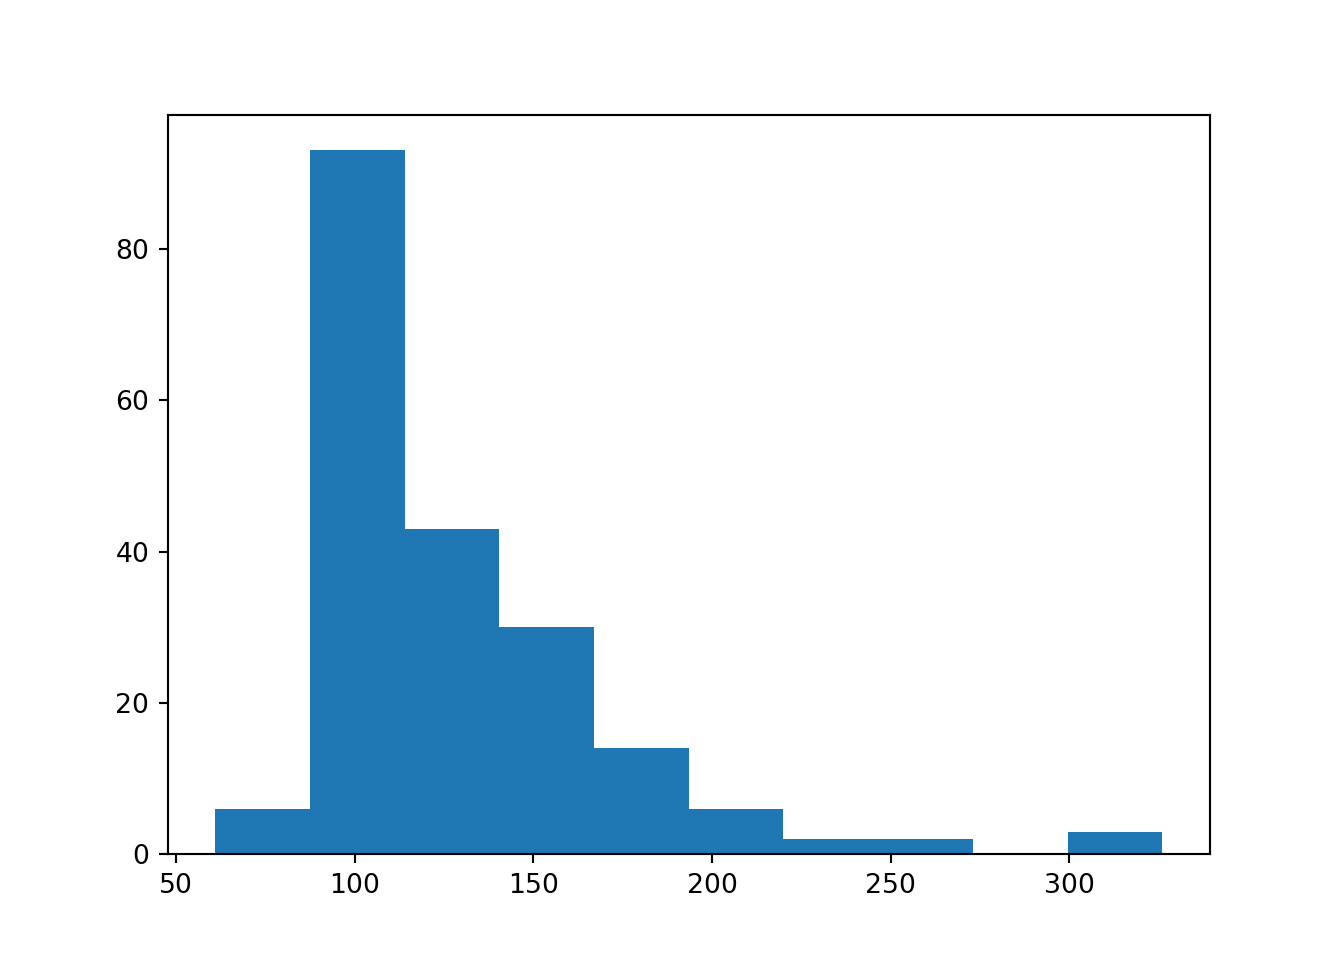
plt.hist("engine-size", data = dad)
plt.show()
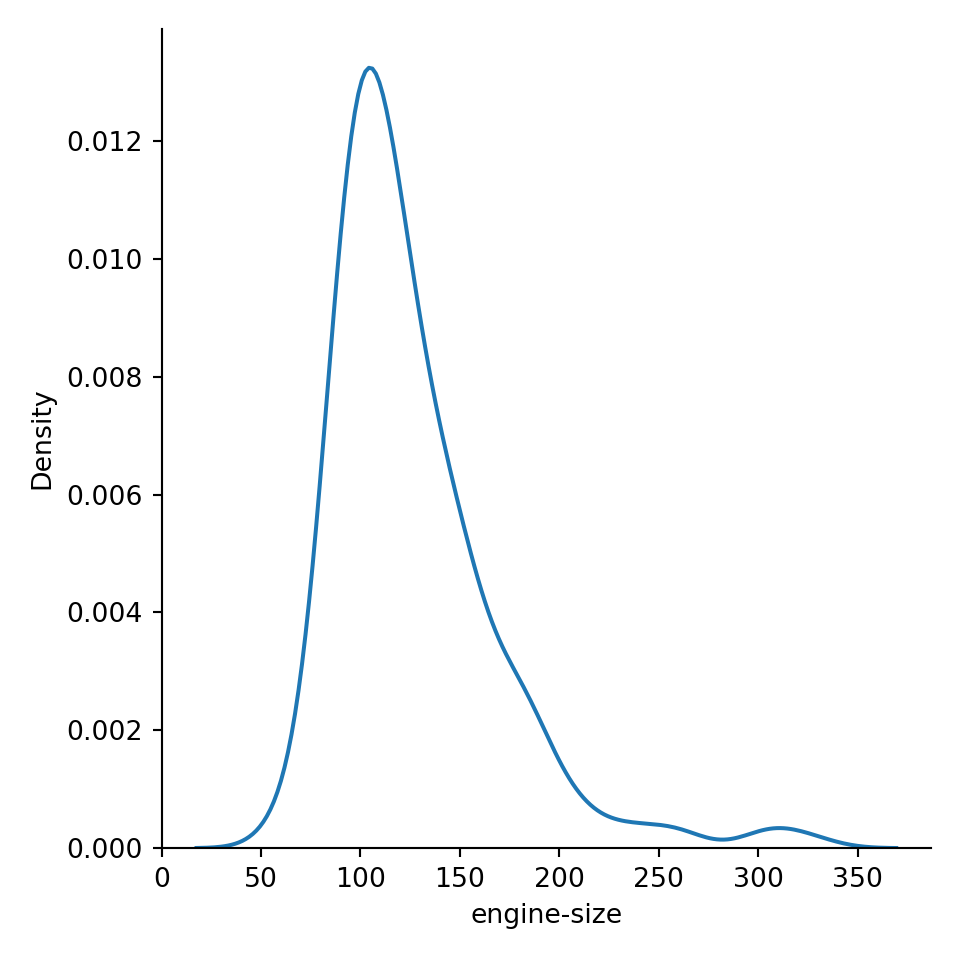
Densidade
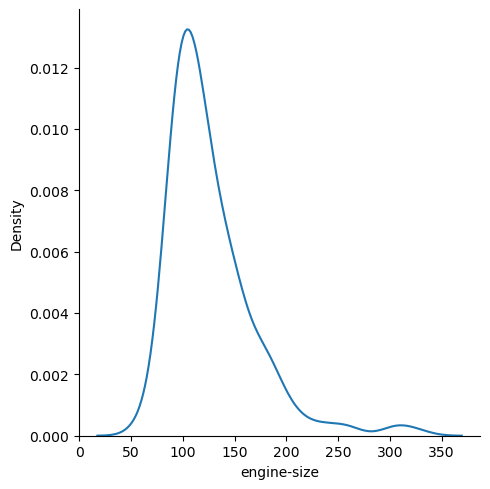
sns.displot(data = dad, x = "engine-size", kind = "kde")
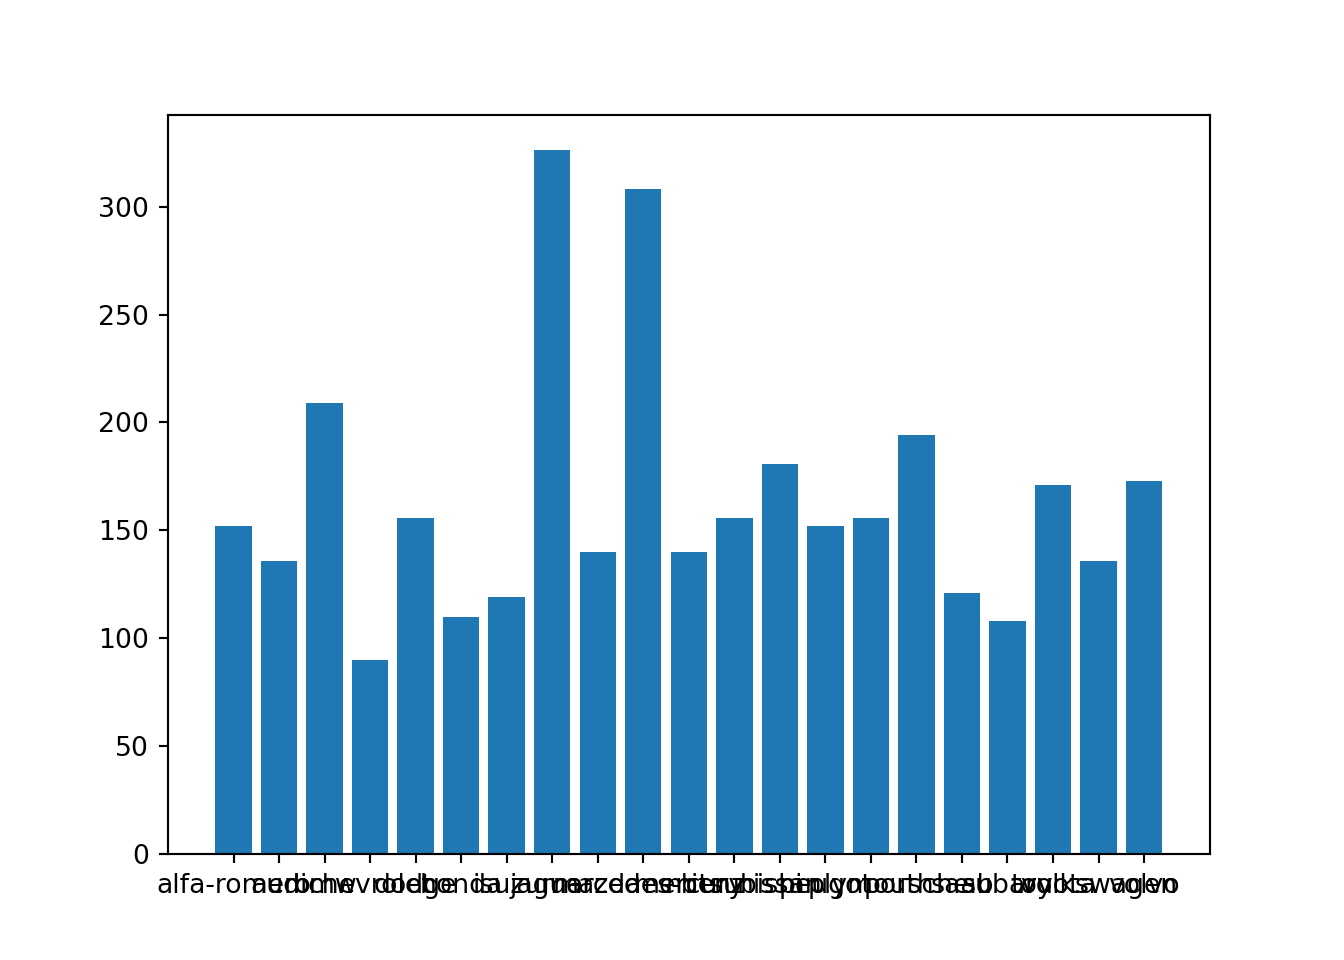
Barras
plt.bar("make","engine-size", data = dad)
plt.show()
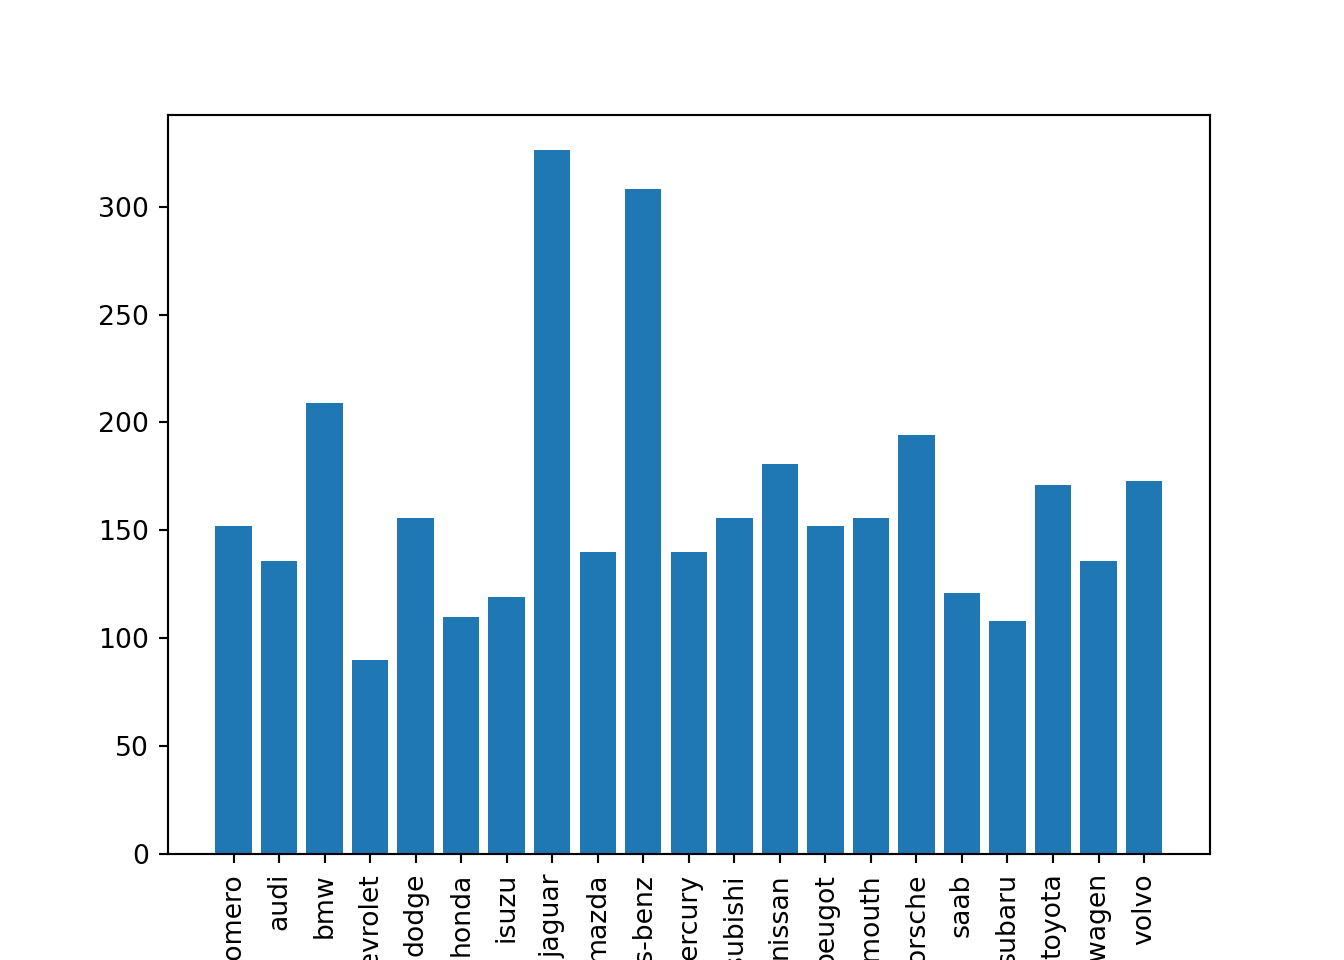
Rotaciona nomes do eixo X
plt.bar("make","engine-size", data = dad)
plt.xticks(rotation=90)
## ([0, 1, 2, 3, 4, 5, 6, 7, 8, 9, 10, 11, 12, 13, 14, 15, 16, 17, 18, 19, 20], [Text(0, 0, 'alfa-romero'), Text(1, 0, 'audi'), Text(2, 0, 'bmw'), Text(3, 0, 'chevrolet'), Text(4, 0, 'dodge'), Text(5, 0, 'honda'), Text(6, 0, 'isuzu'), Text(7, 0, 'jaguar'), Text(8, 0, 'mazda'), Text(9, 0, 'mercedes-benz'), Text(10, 0, 'mercury'), Text(11, 0, 'mitsubishi'), Text(12, 0, 'nissan'), Text(13, 0, 'peugot'), Text(14, 0, 'plymouth'), Text(15, 0, 'porsche'), Text(16, 0, 'saab'), Text(17, 0, 'subaru'), Text(18, 0, 'toyota'), Text(19, 0, 'volkswagen'), Text(20, 0, 'volvo')])
plt.show()
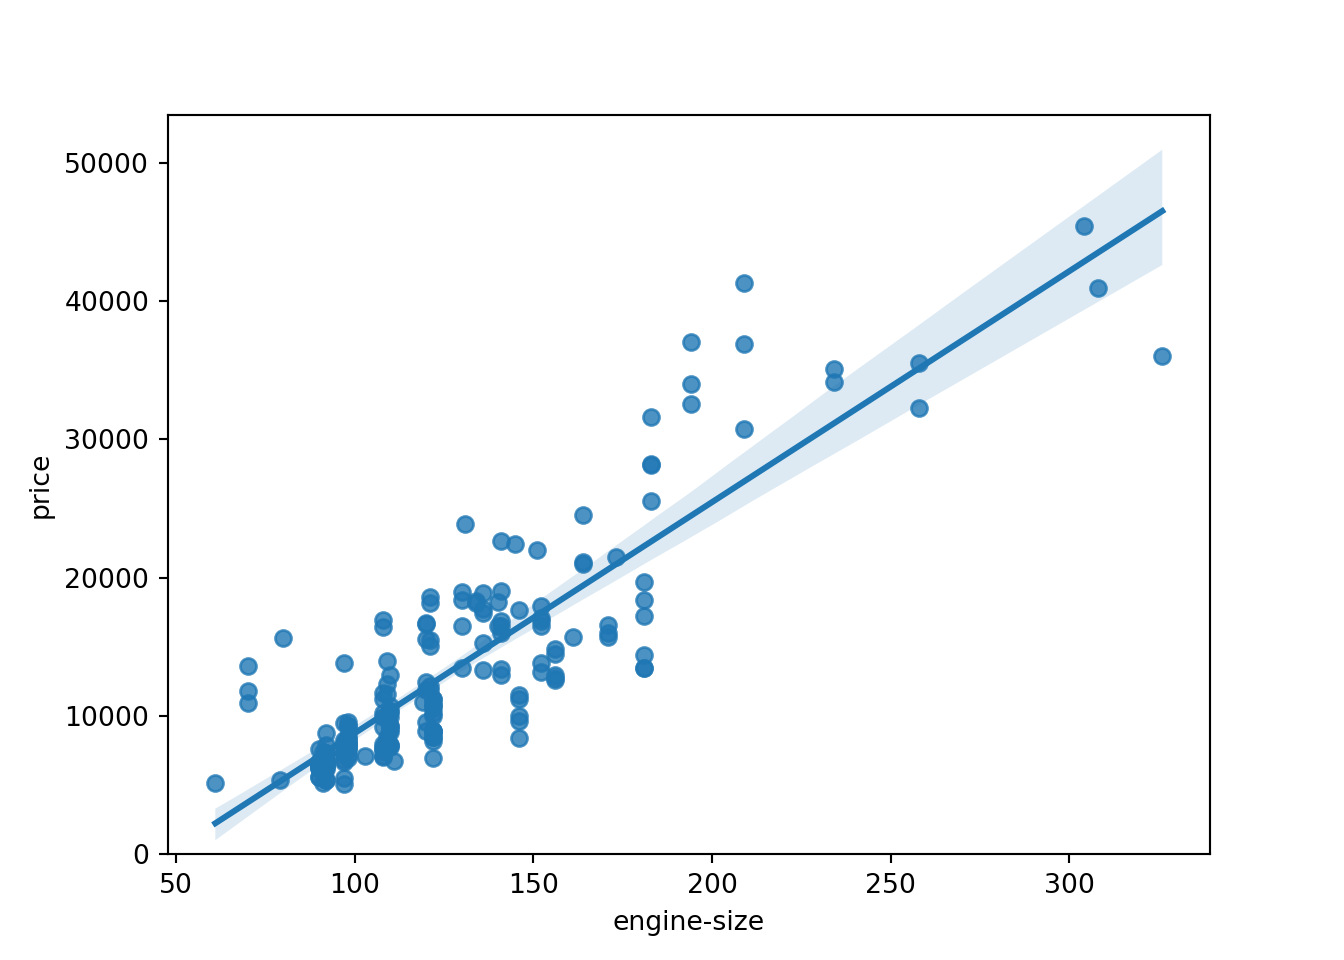
Dispersão com linha de regressão linear
sns.regplot(x = "engine-size", y = "price",data = dad)
plt.ylim(0, )
## (0.0, 53434.45110178258)
plt.show()
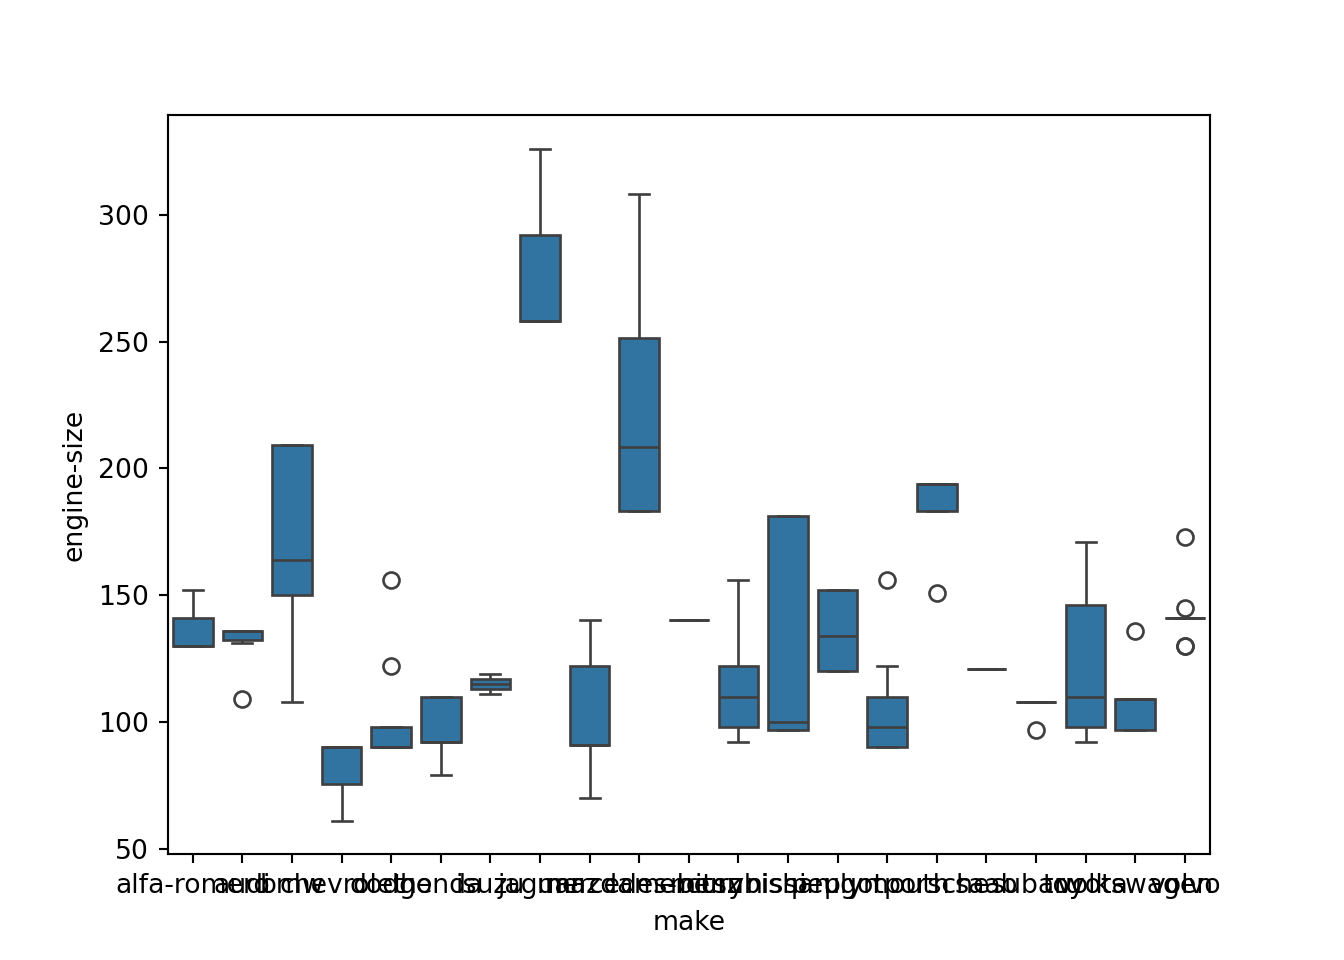
Boxplot
sns.boxplot(x = "make", y = "engine-size", data = dad)
plt.show()
Rotaciona nomes do eixo X
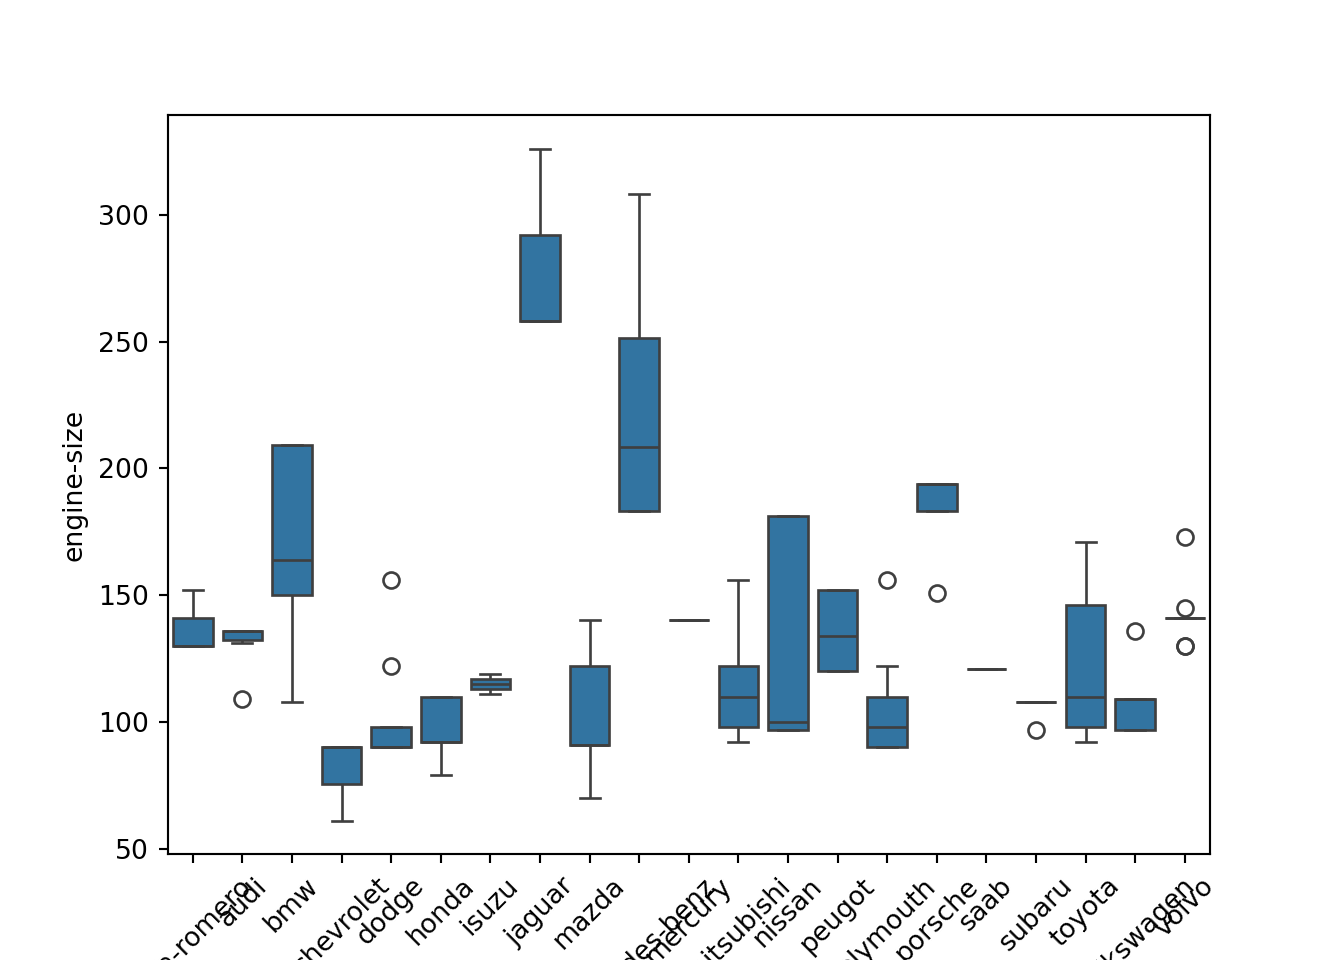
Maneira 1
bplot = sns.boxplot(x = "make", y = "engine-size", data = dad)
bplot.set_xticklabels(bplot.get_xticklabels(), rotation = 45)
plt.show()
Maneira 2
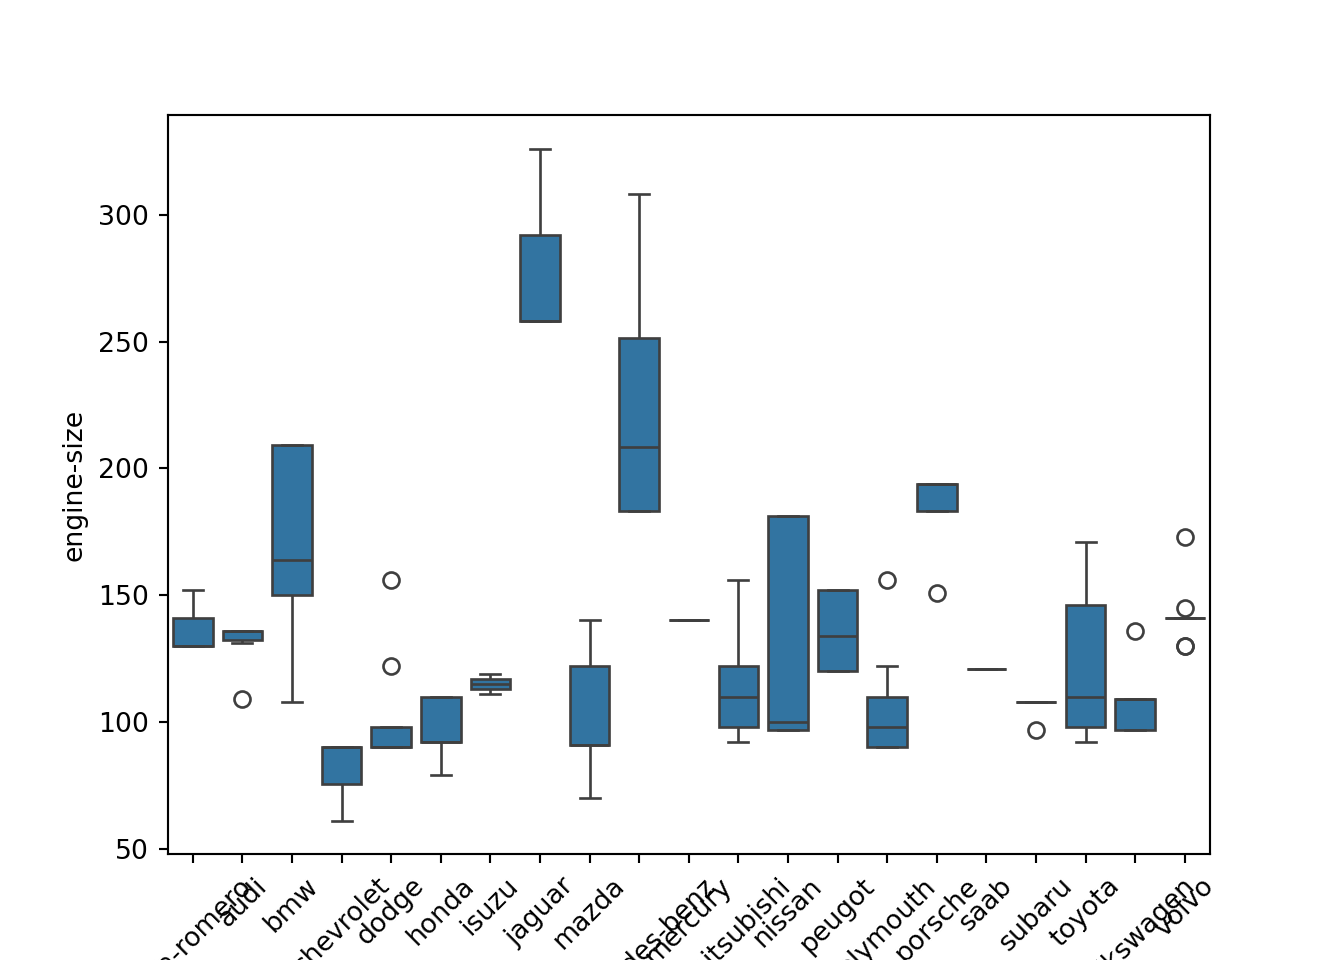
sns.boxplot(x = "make", y = "engine-size", data = dad)
plt.xticks(rotation = 45)
## ([0, 1, 2, 3, 4, 5, 6, 7, 8, 9, 10, 11, 12, 13, 14, 15, 16, 17, 18, 19, 20], [Text(0, 0, 'alfa-romero'), Text(1, 0, 'audi'), Text(2, 0, 'bmw'), Text(3, 0, 'chevrolet'), Text(4, 0, 'dodge'), Text(5, 0, 'honda'), Text(6, 0, 'isuzu'), Text(7, 0, 'jaguar'), Text(8, 0, 'mazda'), Text(9, 0, 'mercedes-benz'), Text(10, 0, 'mercury'), Text(11, 0, 'mitsubishi'), Text(12, 0, 'nissan'), Text(13, 0, 'peugot'), Text(14, 0, 'plymouth'), Text(15, 0, 'porsche'), Text(16, 0, 'saab'), Text(17, 0, 'subaru'), Text(18, 0, 'toyota'), Text(19, 0, 'volkswagen'), Text(20, 0, 'volvo')])
plt.show()
Mapa de calor
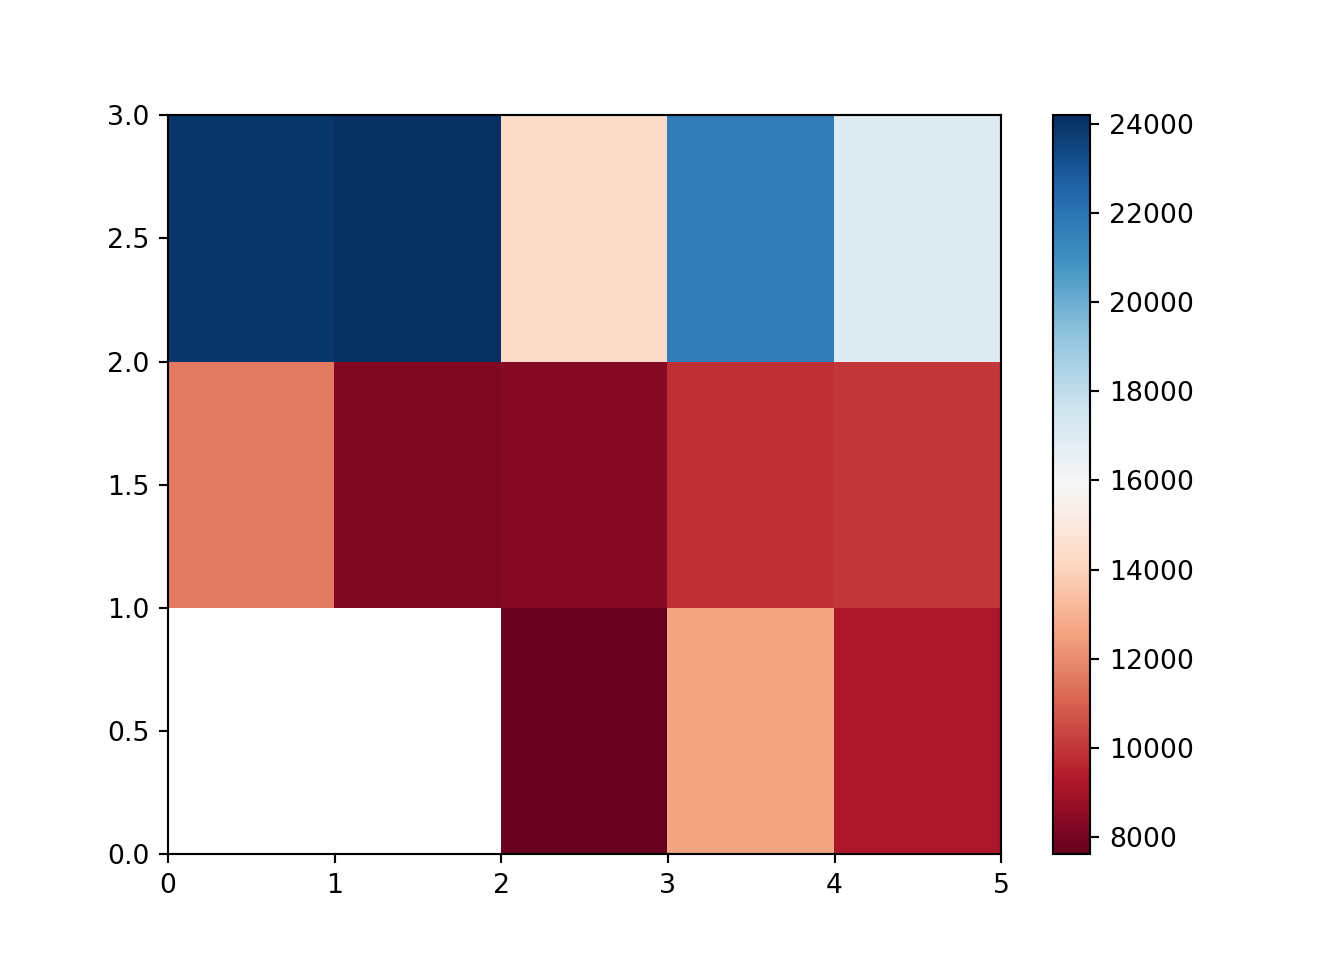
plt.pcolor(dados_dinamicos, cmap = "RdBu")
plt.colorbar()
## <string>:1: MatplotlibDeprecationWarning: Getting the array from a PolyQuadMesh will return the full array in the future (uncompressed). To get this behavior now set the PolyQuadMesh with a 2D array .set_array(data2d).
## <matplotlib.colorbar.Colorbar object at 0x0000016EB2B10C70>
plt.show()
